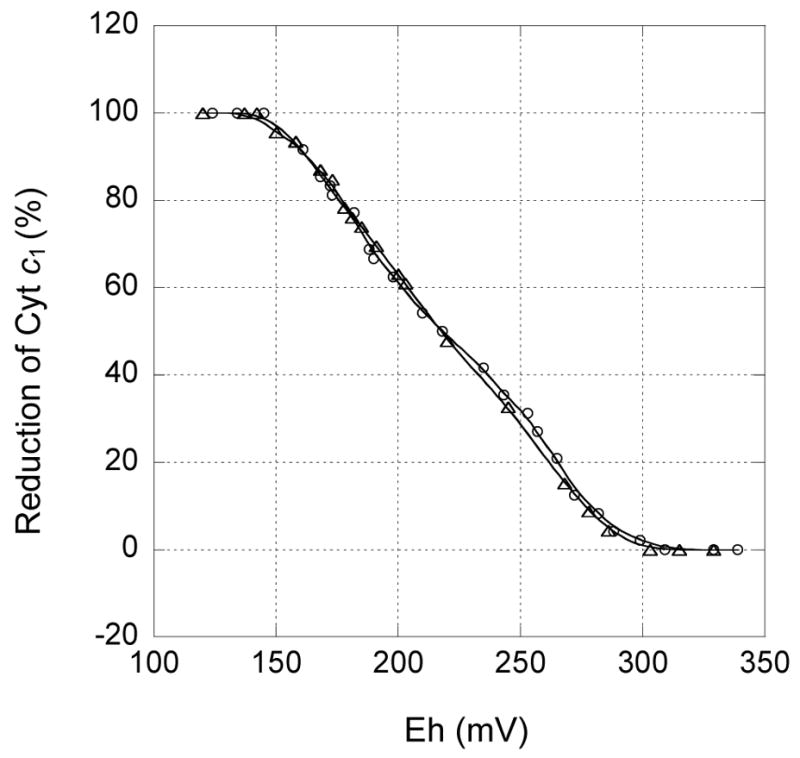
Fig. 5.

Redox potential titration of cytochrome c1 in S141C(ISP)/G180C(cyt c1) bc1 complex. Oxidative and reductive titrations were performed as described in “Experimental Procedures.” Triangle curve shows oxidative titration by ferricyanide and the circle shows reductive titration by dithionite. The data were fit to the Nernst equation when n = 1
