
Figure 1.
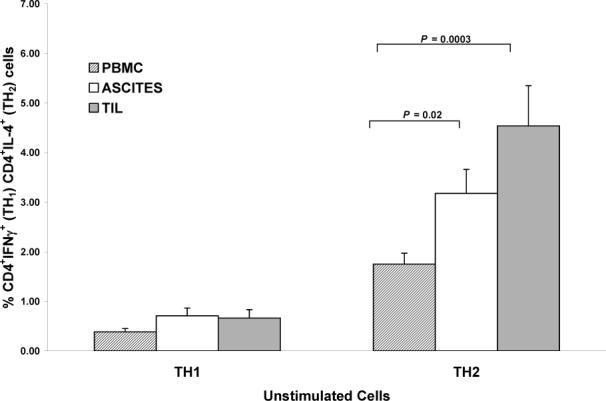
A) Comparisons of unstimulated TH1 and TH2 cells between compartments. For TH1 cells, all between compartment P values > 0.28. For TH2 cells, ascites vs. PBMC (P = 0.024) TIL vs. PBMC (P = 0.0003). Columns: mean, bars: SE. Y-axis in each panel expressed as percent positive cells in the CD3+ population.
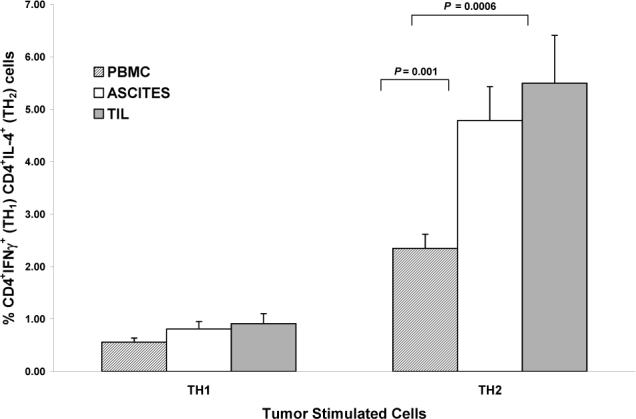
B) Comparisons of tumor-stimulated TH1 vs. TH2 cells between the 3 compartments. For TH1 cells all between compartment P values > 0.49. For TH2 cells, ascites vs. PBMC (P = 0.001), TIL vs. PBMC (P = 0.0006).
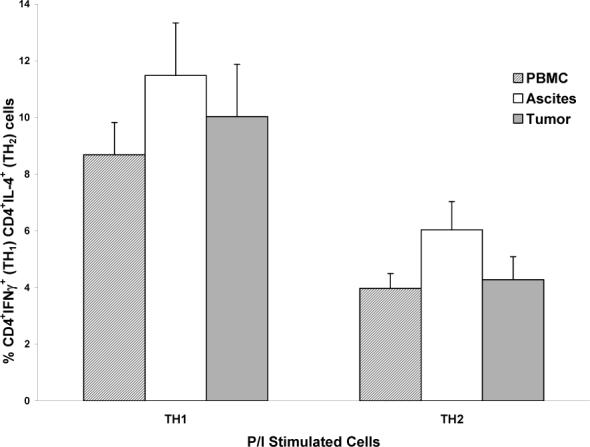
C) Comparisons of P/I-stimulated TH1 and TH2 cells between the 3 compartments. No significant differences seen between compartments for either TH1 or TH2 cells (all P values > 0.41).