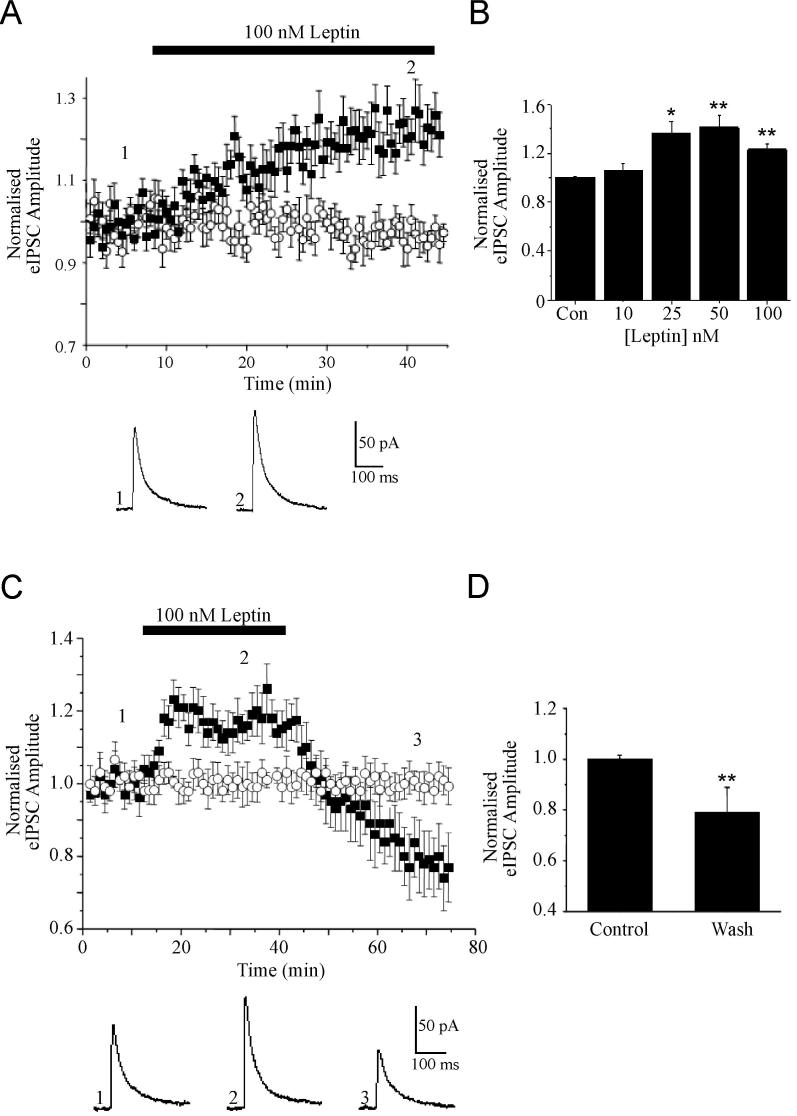
Figure 1. The effects of leptin on evoked GABAA receptor-mediated synaptic currents.
A, Plot of the pooled data illustrating the amplitude of normalized evoked IPSCs against time. Application of leptin (100 nM) for the time indicated by the bar increased eIPSC amplitude that was sustained in the presence of leptin (filled squares). Evoked IPSC amplitude did not vary significantly in interleaved control experiments (open circles). Below the plot are representative examples of synaptic currents obtained prior to (1) and during exposure to leptin (2). B, Histogram of the pooled data showing the relative increase in eIPSC amplitude induced by varying concentrations leptin relative to control. C, Plot of the pooled data of the normalized eIPSC amplitude against time illustrating the effects of leptin washout (filled squares). In interleaved control experiments eIPSC amplitude did not vary significantly (open circles). Below the plot are examples of synaptic currents obtained before (1) and during (2) leptin application and after washout for 30 min (3). D, Histogram of the pooled data showing the relative reductions in eIPSC amplitude induced following washout of leptin for 10 min and 30 min. In this and subsequent figures, *, ** and *** represent P<0.05, P<0.01 and P<0.001, respectively.

