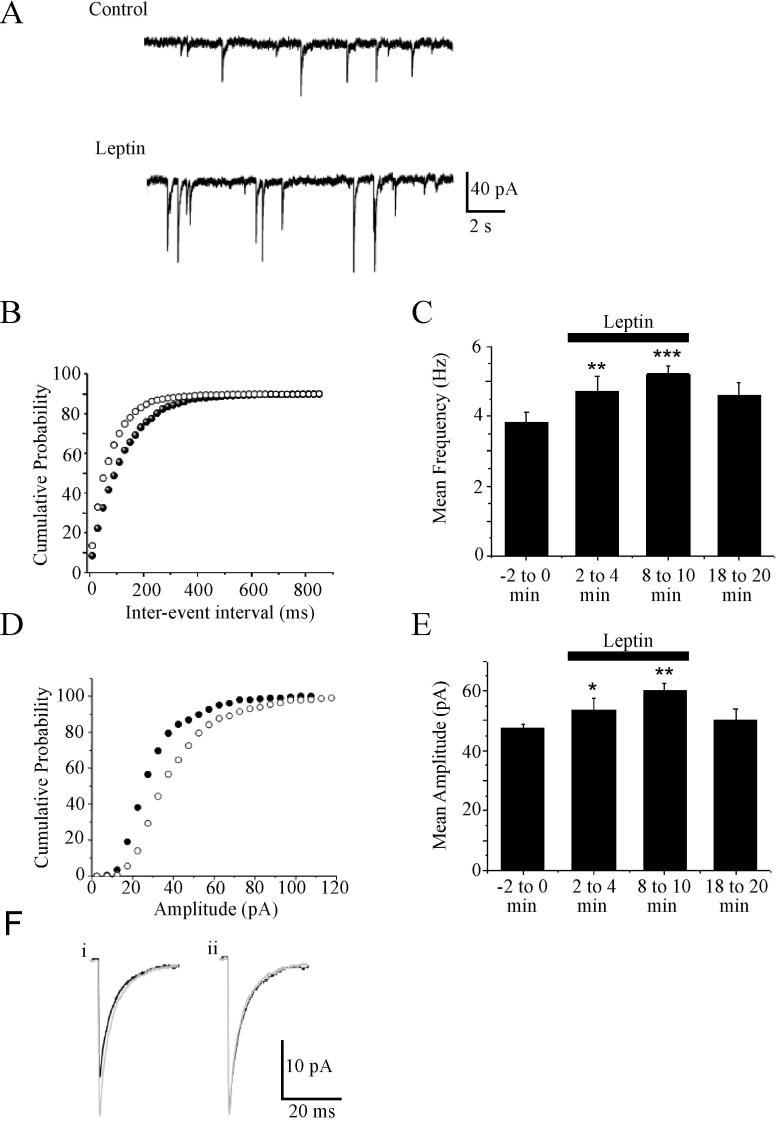
Figure 2. Leptin increases the frequency and amplitude of mIPSCs.
A, Representative traces of mIPSCs recorded from hippocampal CA1 neurons under control conditions and following exposure to leptin (100 nM). Leptin increased the frequency and amplitude of these events. B, Cumulative probability plot illustrating the distribution of the inter-event interval in control (filled circle) and leptin-treated neurons (open circle). C, Histogram of the pooled data of mean mIPSC frequency before (-2 to 0min), during (2 to 4min, 8 to 10 min) and following (18 to 20 min) leptin (100 nM) addition. Leptin increased the frequency of mIPSCs relative to control. D, Cumulative probability plot illustrating the distribution of the amplitude in control conditions (filled circle) and following leptin application (open circle). E Histogram of the pooled data illustrating the mean mIPSC amplitude before (-2 to 0min), during (2 to 4min, 8 to10 min) and following (18 to 20 min) leptin addition. F, Representative averaged traces of mIPSCs in control conditions (black line) and following leptin addition (grey line). i, Leptin increased the mIPSC amplitude relative to control. In ii, the mIPSCs obtained in (i) has been scaled to match the size of mIPSCs obtained following leptin exposure. The effects of leptin are not associated with any change in the kinetic properties of mIPSCs.

