
Figure 12.
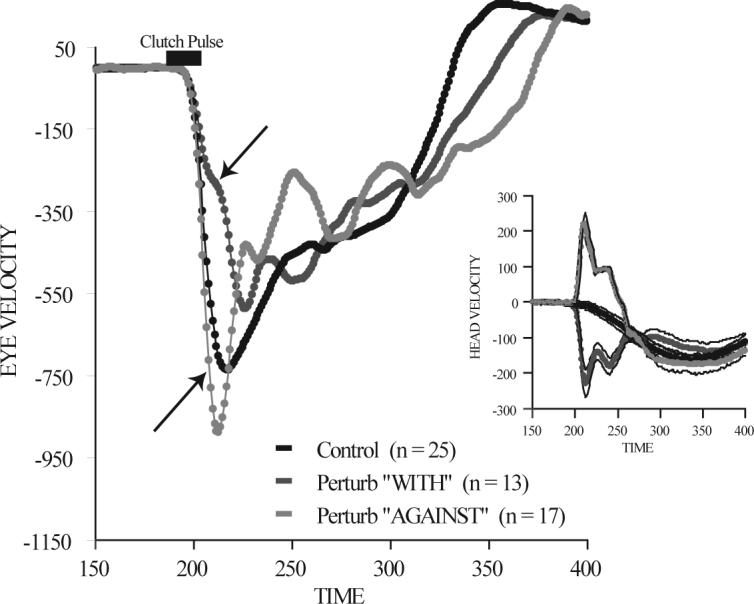
Head perturbation during an ongoing 70° gaze shift. Mean eye velocity is plotted as a function of time during three sets of trials. Control trials (black), trials in which a brief torque pulse was applied to the head driving the head in the direction of the ongoing gaze shift (dark gray), and trials during which the torque pulse drove the head in the direction opposite the ongoing gaze shift (light gray). The inset shows the effects of the torque pulse on the head. Movements were to the left. (modified from Freedman et al. 1998).