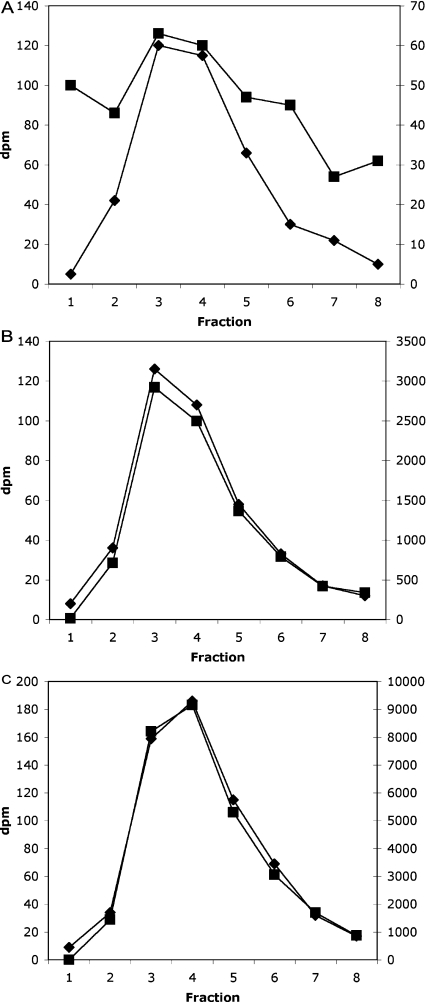
Figure 1. HPLC profile of a liver InsP6 assay.
Three typical profiles from three assay tubes are illustrated, with the radioactivity in the InsP7 region (indicated by the peak in [3H]InsP7 elution) shown. Left-hand axis (◆), [3H]; right-hand axis (■), [32P]. Note the differing scales on the [32P] axes [dpm (d.p.m.)]. (A) Blank incubation (control), (B) 5 μl of liver extract, and (C) 5 μl of liver extract with 10 pmol InsP6 added just before the assay was performed.

