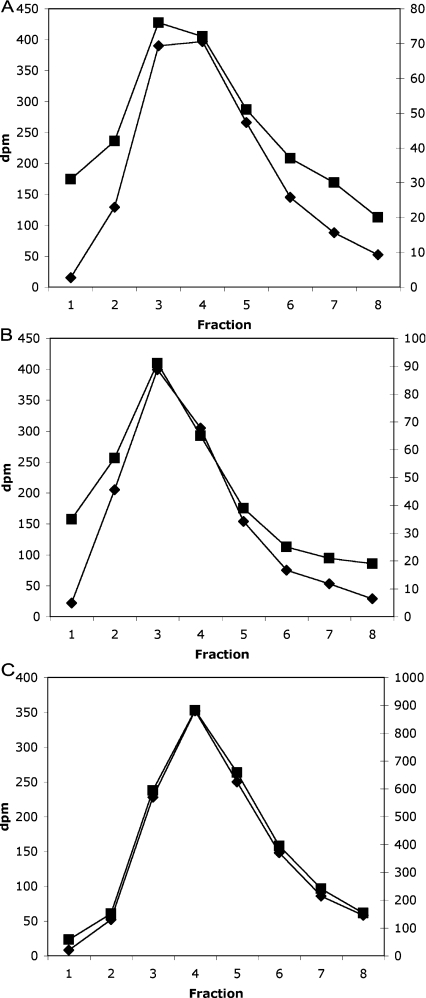
Figure 2. HPLC profile of a human plasma InsP6 assay.
Three typical HPLC profiles from three assay tubes are illustrated, with the radioactivity in the InsP7 region (indicated by the peak in [3H]InsP7 elution) shown. Left-hand axis (♦), [3H]; right-hand axis (■), [32P]. Note the differing scales on the [32P] axes [dpm (d.p.m.)]. (A) Blank incubation (control), (B) extract of 100 μl of human plasma, and (C) extract of 100 μl of human plasma with 2.5 pmol (25 nM final concentration) InsP6 added before extraction.

