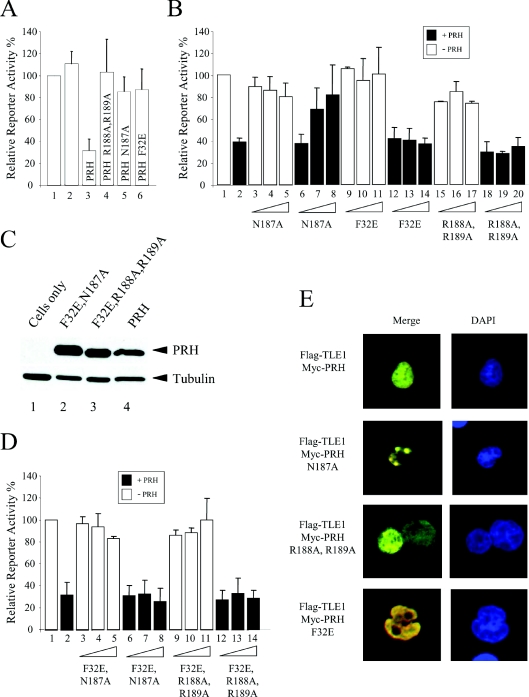
Figure 5. PRH N187A is trans-dominant over PRH in transcription repression assays.
The histograms show the relative promoter activity found in K562 cell extracts 24 h after transient co-transfection with a reporter plasmid containing the luciferase gene under the control of the TK promoter and five PRH-binding sites (pTK–PRH), a β-galactosidase expression plasmid (pSV-lacZ) and PRH expression vectors. Relative promoter activity is the luciferase activity normalized with respect to transfection efficiency using the co-transfected β-galactosidase plasmid. Each transfection was performed a minimum of three times and the values shown are the means±S.D. (A) K562 cells were transfected with 5 μg of pTK–PRH alone (lane 1), pTK–PRH and 1 μg of an empty expression vector (lane 2), or pTK–PRH and 1 μg of pMUG1-PRH (lane 3), pMUG1-PRH R188A,R189A (lane 4), pMUG1-PRH N187A (lane 5) or pMUG1-PRH F32E (lane 6). (B) K562 cells were transfected with 5 μg of pTK–PRH alone (lane 1), pTK–PRH and 1 μg of pMUG1-PRH (lane 2), or pTK–PRH and increasing amounts (0.5, 1 and 2 μg) of the expressor plasmids indicated either with (filled bars) or without (empty bars) 1 μg of co-transfected pMUG1-PRH. (C) Whole-cell extracts were prepared from untransfected K562 cells (lane 1) and cells transiently transfected with vectors expressing Myc–PRH F32E,N187A (lane 2), Myc–PRH F32E,R188A,R189A (lane 3) or Myc–PRH (lane 4). The proteins were then separated by SDS/PAGE and Western blotted for PRH using an anti-Myc9E10 antibody. The membrane was stripped and reprobed with an anti-tubulin antibody as a control for protein loading. (D) The experiment described in (B) was repeated using vectors expressing the PRH double mutants PRH F32E,N187A and PRH F32E,R188A,R189A. (E) K562 cells were transiently transfected with vectors expressing FLAG–TLE1 and Myc–PRH or Myc-tagged PRH mutant proteins and then adhered to poly-lysine-coated coverslips. DNA was stained with DAPI (blue). FLAG–TLE1 was visualized using an anti-FLAG antibody and a FITC-labelled secondary antibody (green). Myc–PRH was visualized using an anti-Myc9E10 antibody and a TRITC-labelled secondary antibody (red). The cells were viewed using confocal microscopy. Co-localized proteins produce a yellow colour.

