FIGURE 3.
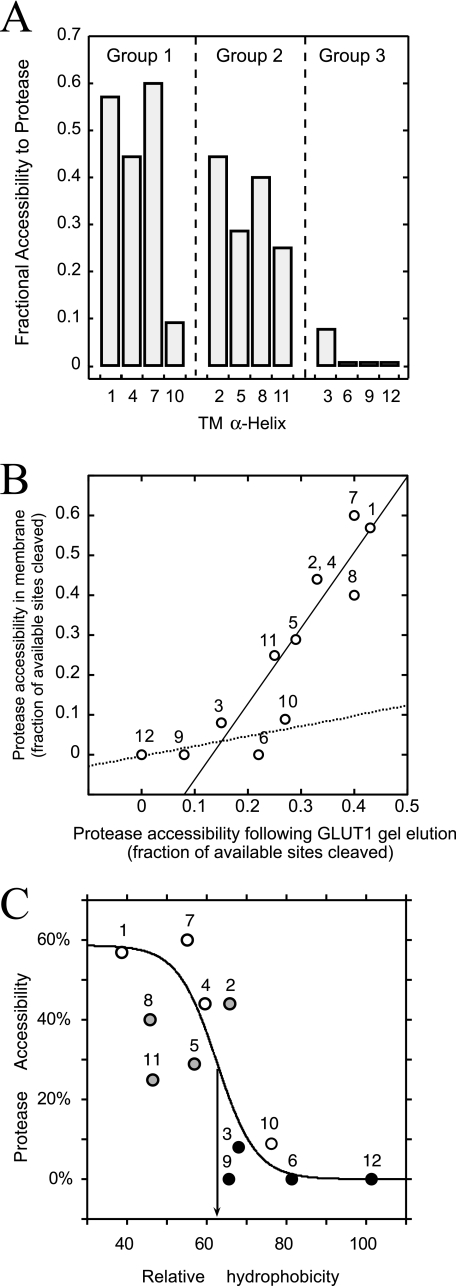
Protease accessibility of bilayer-embedded TMs. TMs are colored as in Fig. 1. A, GLUT1 TM protease accessibility (ordinate) arranged by TM number (abscissa) and group classification (above the bars). Accessibility is the ratio of experimentally observed to potential cleavage sites (trypsin and α-chymotrypsin). B, GLUT1 TM protease accessibility in membranes (ordinate, see A) versus GLUT1 TM protease accessibility following SDS-PAGE elution (abscissa). Lines were calculated by linear regression. The solid line is drawn through TMs 1, 2, 4, 5, 7, 8, and 11. The dashed line is drawn though TMs 3, 6, 9, 10, and 12. C, observed TM protease accessibility (ordinate) versus TM relative hydrophobicity (abscissa; calculated as sequence-specific retention score (42)). The S-shaped curve was obtained by nonlinear regression assuming protease accessibility (P) is related to TM hydrophobicity (H) through the logistic function P = a/(1 + m × n-H) where a, m, and n are 58.7 ± 15, (3.13 ± 0.14) × 10-6, and 0.82 ± 0.09, respectively. The inflection point (arrow) occurs at 62.5% relative hydrophobicity. TMs are numbered.

