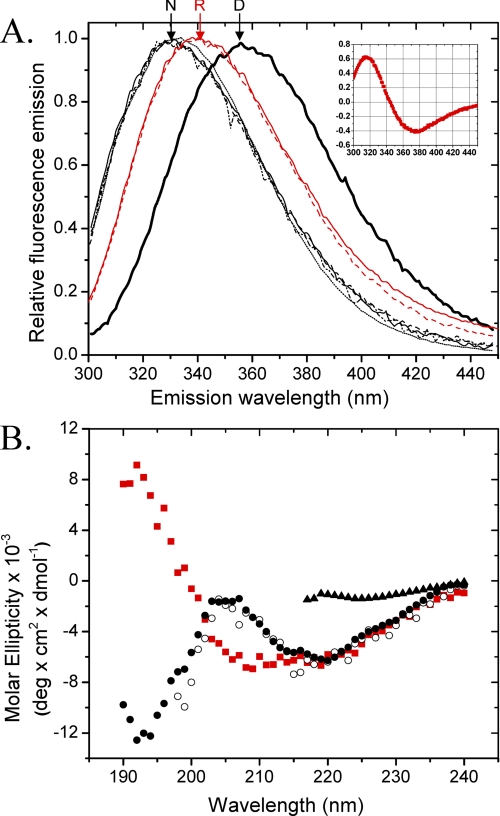
FIGURE 2.
A, the fluorescence emission spectra upon excitation at 280 nm of native MfpA (solid line, dashed and dotted line, and dashed line) and MfpA-C179S (dotted line) in Buffer A (solid line and dotted line) and Buffer B (dashed and dotted line). Denatured MfpA and MfpA-C179S were incubated in Buffers A and B to which was added 8.5 m urea (thick line). Additional spectra show MfpA in Buffer A (solid red line) and Buffer B (dashed red line) refolded by dialysis. N, R, and D, native, refolded by dialysis, and denatured MfpA, respectively. Inset, the derivative of the R spectrum from which the exact position of λmax is determined; B, the CD spectra of native MfpA in Buffer A (○) and Buffer B (•), MfpA refolded by dialysis of the urea into Buffer B (red square]), and denatured MfpA (▴). The protein concentration is 1 and 4 μm for the fluorescence and CD measurements, respectively. Buffers A and B are described under “Experimental Procedures.”

