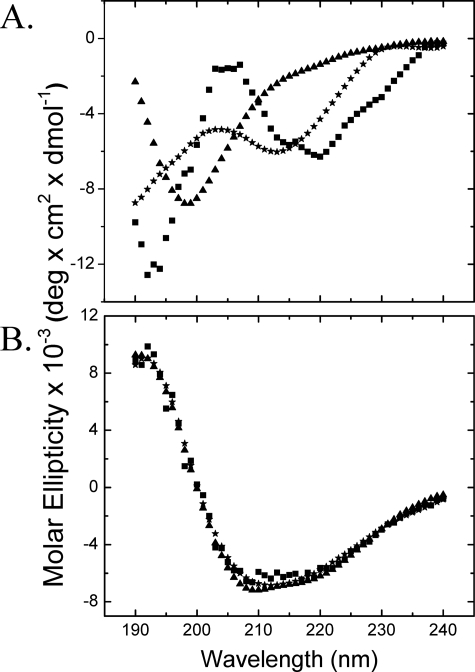
FIGURE 5.
The CD spectra of native (A) and dialysis-renatured (B) MfpA. The experimentally determined CD spectra (▪) in Buffer B at the conditions similar to those of Fig. 2B are shown along with spectra calculated from the secondary structure contents shown in Table 1 (ContinLL, ⋆; Selcon3, ▴). The calculated spectra are based on the 48-protein reference set available in CDPro. Reference sets of 43 proteins (CDPro) or 72 proteins (DICHROWEB) provide similar results.

