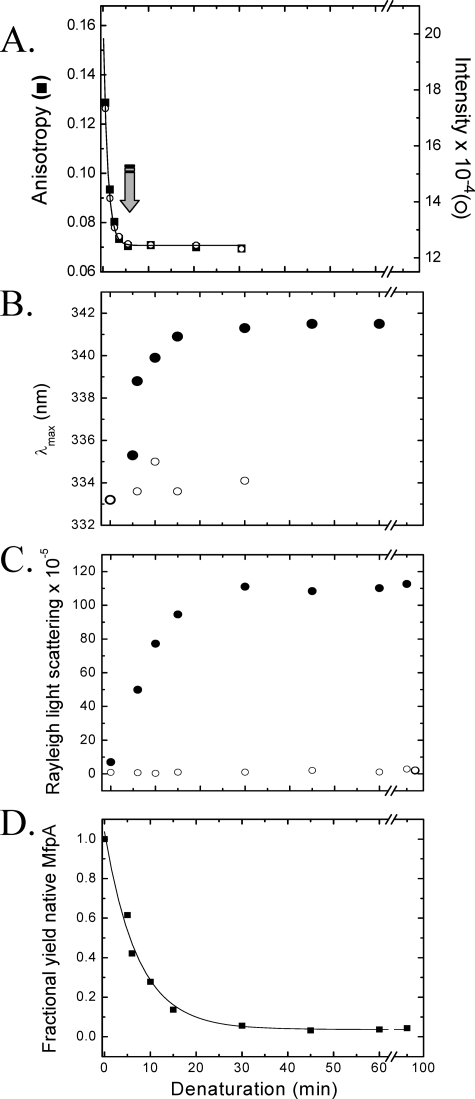
FIGURE 6.
A, time progress curve of the denaturation of MfpA upon the addition of 8.5 m urea (to a final concentration of 6.4 m), as evidenced by the fluorescence anisotropy (▪) and intensity (○) measured at 324 nm upon excitation at 280 nm. The solid line depicts the best fit to a monoexponential equation with a rate constant, r = 0.97 ± 0.046 min-1. The arrow marks the minimum time at which “time-dependent renaturation” was initiated (see below and “Experimental Procedures”). B–D track the changes in the optical parameters of the solutions containing MfpA during “time-dependent renaturation” as a function of refolding time. B, λmax of fluorescence emission following excitation at 280 nm; C, Raleigh light scattering recorded at 350 nm; D, quantitative yield of native MfpA. The x axis plots the denaturation time prior to which refolding was initiated by the addition of a 10-fold excess of Buffer A. The samples were then incubated for 30 min in Buffer A prior to the measurement of the optical parameters (•). Samples in which high molecular weight aggregates were cleared by ultracentrifugation are shown in B and C by an open circle. The protein concentration is 1 μm.

