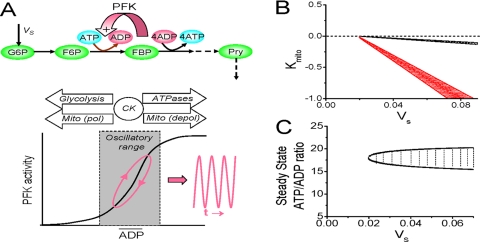
FIGURE 1.
A, simplified schema of the glycolytic oscillator, based on positive feedback of free ADP on PFK activity. Oscillations (due to a substrate depletion mechanism) develop when the steady-state free ADP level engages the steep portion of the PFK activity curve (lower graph). The arrows indicate how mean ADP levels are regulated by glycolysis, polarized (pol) or depolarized (depol) mitochondria, and cytosolic ATPases, facilitated by CK. VS, input flux of glycolytic substrate (glucose or glycogen); FBP, fructose-1,6-biphosphate. The dashed arrows represent the molecular steps indicated for clarity of metabolic pathways but not explicitly formulated in the modeling equations. B, phase diagram in VS - kMito parameter space from the simplified model (see supplemental material). Oscillatory regions are indicated with the CK system intact (black lines) or 90% inhibited (red lines). C, phase diagram in steady state free ATP/ADP ratio - VS parameter space from the simplified model. The oscillatory region is cross-hatched. See “Results” for details.

