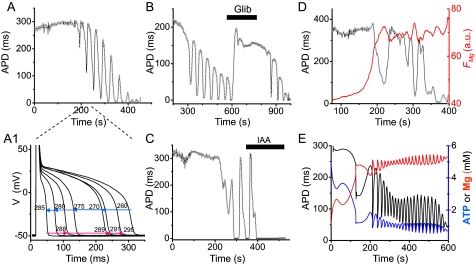
FIGURE 2.
APD oscillations during metabolic inhibition. A, APD recorded in the current clamp mode from a whole cell patch clamped myocyte exposed to glucose-free buffer containing 450 μm 3-merc plus 5 mm cyanide and 100 μm DNFB. A1, superimposed action potentials recorded during the oscillation cycle from 260–295 s in A. B and C, inhibition of APD oscillations by the (reversible) ATP-sensitive K channel blocker glibenclamide (10 μm) in B and the (irreversible) glycolytic inhibitor iodoacetate (0.1 mm) in C, under the same conditions as in A. D, Mg Green fluorescence (FMg; red line) during APD oscillations (black line) under the same conditions as in A. FMg increases, consistent with ATP depletion causing APD shortening via activation of ATP-sensitive K channels, and then oscillates out of phase with APD, as expected if FMg is tracking intracellular ATP. E, numerical simulations from the detailed model, showing oscillations in APD, ATP, and free Mg when glucose removal is simulated linearly decreasing in VS after inhibiting both oxidative phosphorylation and CK to mimic the effects of cyanide and DNFB (see supplemental material). a.u., arbitrary units.

