FIGURE 3.
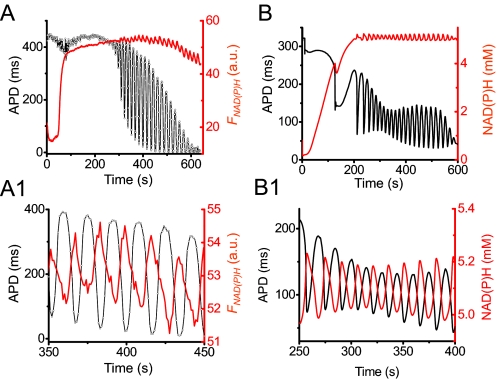
NAD(P)H and ΔΨm during APD oscillations. A, simultaneous recordings of NAD(P)H autofluorescence (FNAD(P)H; red) and APD (black) from a myocyte exposed to glucose-free buffer containing 450 μm 3-merc plus 5 mm cyanide. A1, expanded traces between 350–450 s, showing that APD and FNAD(P)H are oscillating out of phase. B and B1, corresponding simulations from the detailed model (see supplemental material). a.u., arbitrary units.

