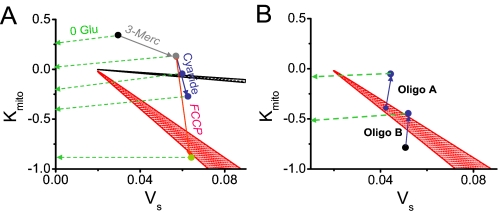
FIGURE 5.
Phase diagrams in VS - kMito parameter space from Fig. 1B. A, dashed green arrows show hypothetical slow trajectories following glucose removal, after various metabolic interventions (as labeled) have rapidly altered Kmito (solid arrows). B, analogous hypothetical trajectories (dashed green arrows) for the suppression (Oligo A) or induction (Oligo B) of glycolyctic oscillations by oligomycin, corresponding to Fig. 4, A and B, respectively. Stippled zones indicate oscillatory regions in the absence (black) and presence (red) of DNFB. See “Discussion” for details.

