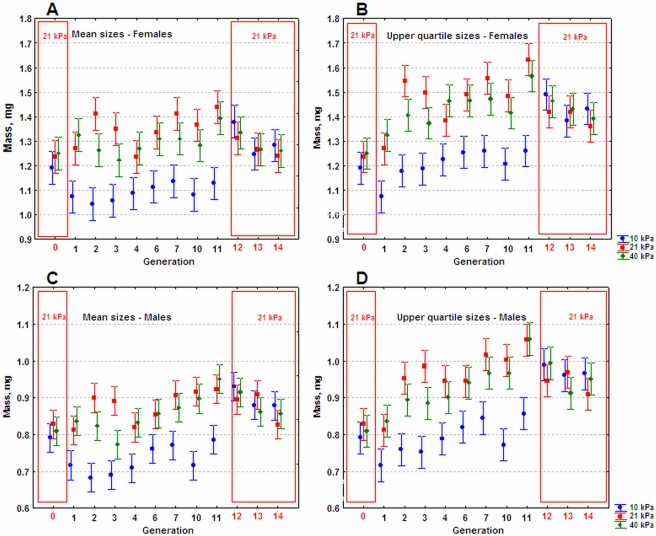
Figure 2. Plots of mass changes across generations.
Mean adult masses (females above, males below) of five selected populations of Drosophila melanogaster (left), and mean masses of the largest quartile of those populations (values shown are the means±0.95 confidence intervals of the five population means for each treatment). Generation zero represents initial values of starting populations all reared in 21 kPa (included in red box). From generations 1–11, directional selection for large size was applied in either hypoxic (10 kPa, blue dots), normoxic (21 kPa, red squares) or hyperoxic (40 kPa, green diamonds) conditions. During generations 12–14, populations were returned to 21 kPa (included in red box) and no selection was performed. Non-overlapping 0.95 CI whiskers indicate significant differences. Due to questionable growth medium quality, generations 5, 8 and 9 were excluded from all analyses.

