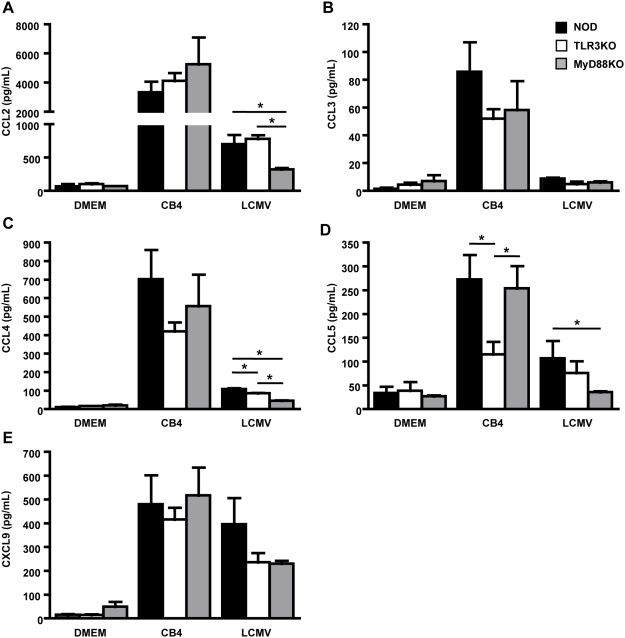
Figure 6. TLR3 deficiency results in reduced production of CCL5 following CB4 infection.
Serum levels of A) CCL2, B) CCL3, C) CCL4, D) CCL5 and E) CXCL9 from WT NOD (black bars), TLR3KO (white bars) and MyD88KO (grey bars) mice were measured with a CBA chemokine flex set 4 days following infection with 400 pfu of CB4, 1×10⁵ pfu of LCMV or mock-infection with DMEM. n = at least 3 for DMEM and LCMV treatments and n = at least 5 mice for CB4 treatments. Pooled data from at least 2 independent experiments are presented as mean+/−s.e.m. Stars denote statistical significance.

