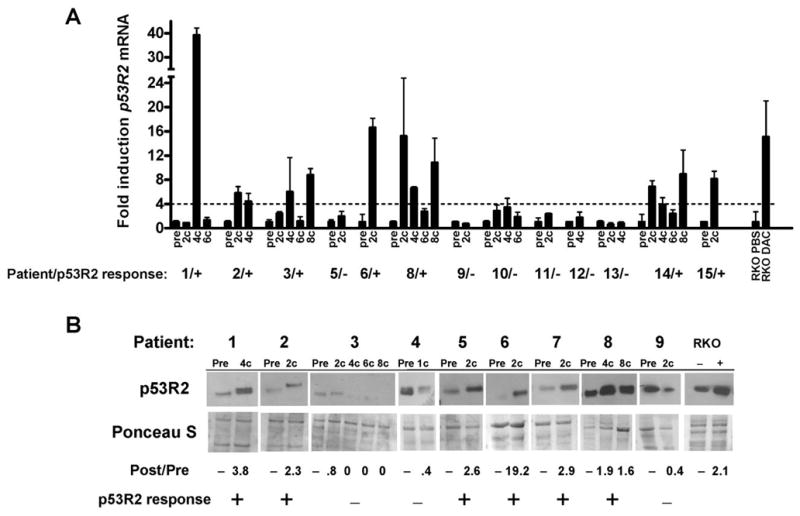
Fig. 4.

Decitabine treatment induces p53R2 mRNA and protein expression in MDS/AML patient bone marrow. A, p53R2 expression in bone marrow samples obtained from 13 MDS/AML patients undergoing decitabine therapy. Pre- and post-treatment samples are shown, and the number of cycles of therapy (#c) is listed for post-treatment samples. p53R2 expression was measured by qRT-PCR. For each patient, p53R2 expression was normalized to GAPDH, and pre-treatment samples were each set at one to normalize between patients. Plus signs (+) indicate patients in whom at least one post-treatment sample showed biologically significant (defined as > 4 fold) p53R2 induction compared to the pre-treatment sample. Dashes (−) indicate patients for whom no post-treatment sample showed significant p53R2 induction. p53R2 expression in RKO cells treated with decitabine (DAC) for five days is shown as a positive control. Note that patients #4 and #7 did not yield sufficient quality RNA for analysis and are not shown. B, p53R2 Western blot analysis of cytosolic protein extracts harvested from bone marrow samples from nine MDS/AML patients undergoing decitabine therapy. Pre- and post-treatment samples are shown, and the number of cycles of therapy (#c) is listed for post-treatment samples. Fold induction (or decline) relative to the pretreatment sample is shown beneath the Western blot. Plus signs (+) indicate patients in whom the post-treatment samples showed biologically significant (defined as > 1.5 fold) p53R2 induction. Dashes (−) indicate patients in whom p53R2 induction was not observed. RKO cells treated with decitabine (DAC) for five days are shown as a positive control. Ponceau S staining confirmed equivalent protein loading. Note that patients #10–15 did not yield sufficient quality protein for analysis and are not shown.
