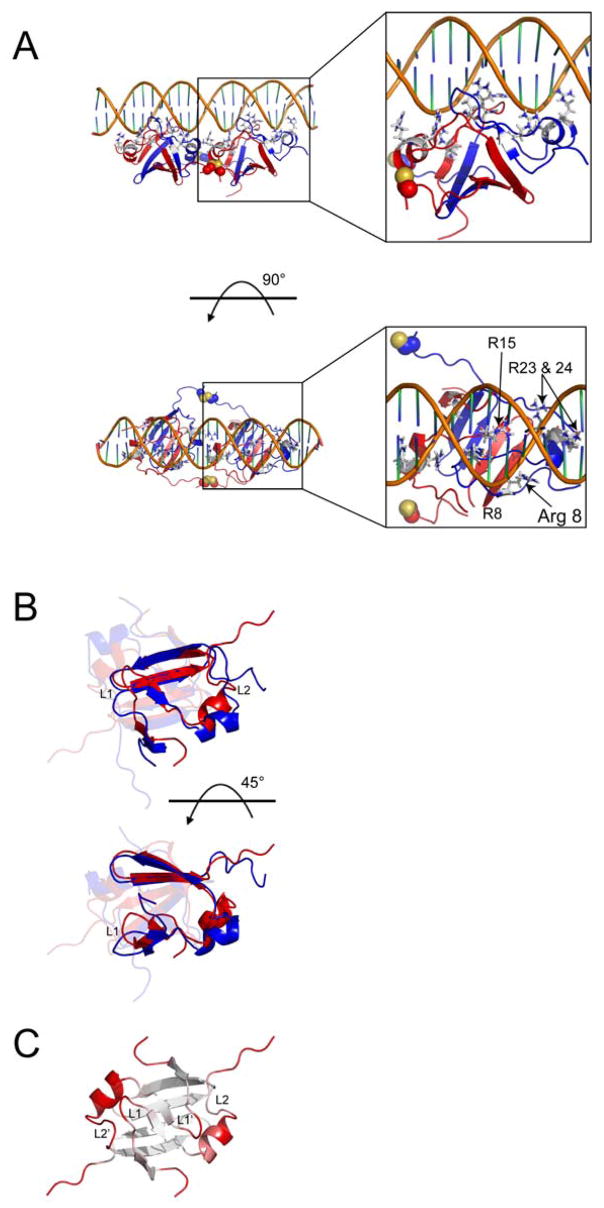
Figure 4.
Lowest energy DNA-bound AbrBN55 model from semi-flexible docking and comparison to unbound AbrBN53. (A) Two views of the lowest energy HADDOCK structure from the semi-flexible docking studies. Disulfide linkages are shown as spheres in the image. Insets show a detailed look at the positioning of the arginine residues involved in binding. (B) Overlay of unbound AbrBN53 (red) and the lowest HADDOCK score model of AbrBN55 bound to abrB8 (blue). One monomer is highlighted for clarity. (C) The degree of structural variation between the unbound AbrBN53 NMR structure and the modeled AbrBN55 bound to abrB8, colored from white (little variation) to red (large variation) as calculated in the Cα alignment by THESEUS plotted on the refined AbrBN53 solution structure. The unbound and bound AbrBN53 dimer structures overlay with a Cα r.m.s.d. of 2.84Å. LP 1 and 2 (chain A) and 1′ and 2′ (chain B) are noted. Proteins are oriented as depicted in Figure 1 on structures most similar to the average structure in the ensemble reported by THESEUS.

