
Figure 1.
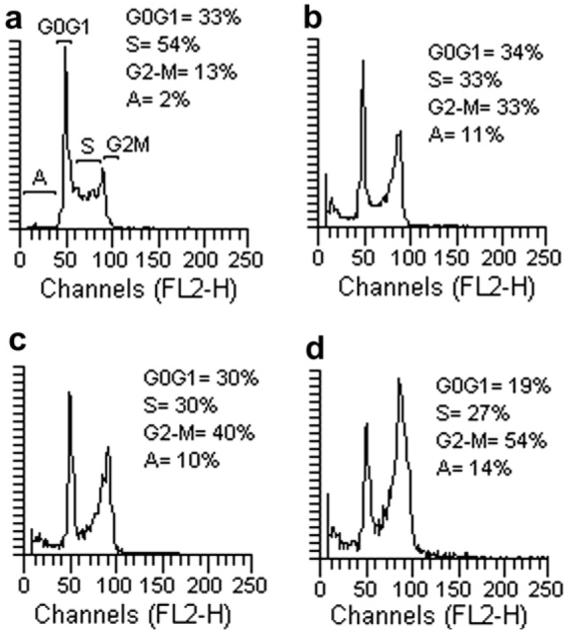
Effects of compounds 4f (panel b), 4g (panel c), and 5 (panel d) on DNA content/cell following treatment of K562 cells for 24 h. The cells were cultured without compound (panel a) or with compound used at the concentration leading to 50% cell growth inhibition after 24 h of treatment. Cell cycle distribution was analyzed by the standard propidium iodide procedure. Sub-G0-G1 (apoptotic peak, A), G0-G1, S, and G2-M cells are indicated in the panel (a).