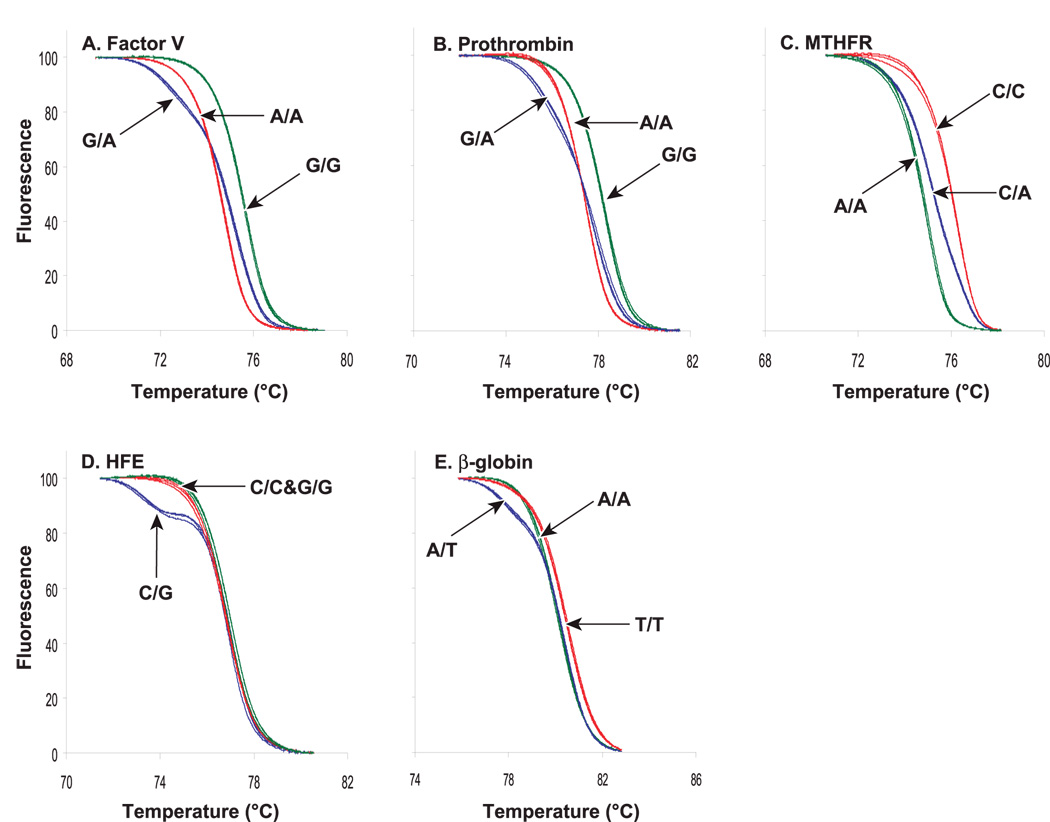
Figure 2.
Normalized, high-resolution melting curves from (A) factor V (Leiden) 1691G>A, (B) prothrombin 20210G>A, (C) MTHFR 1298A>C, (D) HFE 187C>G, and beta-globin 17A>T SNPs. Three individuals of each genotype were analyzed and are displayed for each SNP. Wild-type (green), heterozygous (blue) and homozygous mutant (red). Reprinted with permission from Clin Chem 50, 1156-1146 (2004).

