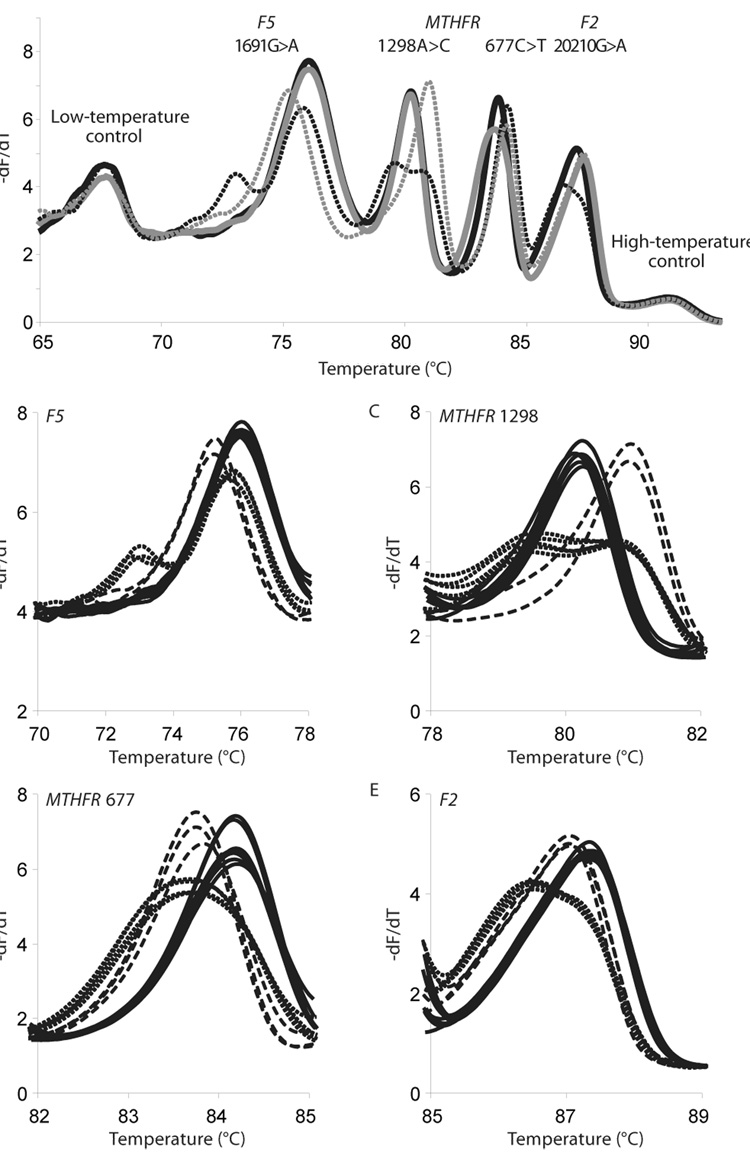
Figure 3.
Derivative melting plots for the multiplex thrombophilia melting assay. (A): Four representative melting profiles containing examples of all of the genotypes for each locus. Melting plots are shown as a solid black line (F5 1691GG, MTHFR 1298AA and 677TT, and F2 20210AA), a solid gray line (F5 1691GG, MTHFR 1298AA and 677CT, and F2 20210GG), a dotted black line (F5 1691GA, MTHFR 1298AC and 677CC, and F2 20210GA), and a dotted gray line (F5 1691AA, MTHFR 1298CC and 677CC, and F2 20210GG). The derivative melting plot includes all 4 thrombophilia loci and 50-bp complementary oligonucleotide temperature-correction controls for high and low temperature. (B–E): Representative derivative melting plots for the F5 1691, MTHFR 1298, MTHFR 677, and F2 20210 loci, with homozygous wild-type, homozygous variant, and heterozygous genotypes indicated by solid black lines, dashed black lines, and dotted black lines, respectively. Reprinted with permission from Clin Chem 54, 108–115 (2008).

