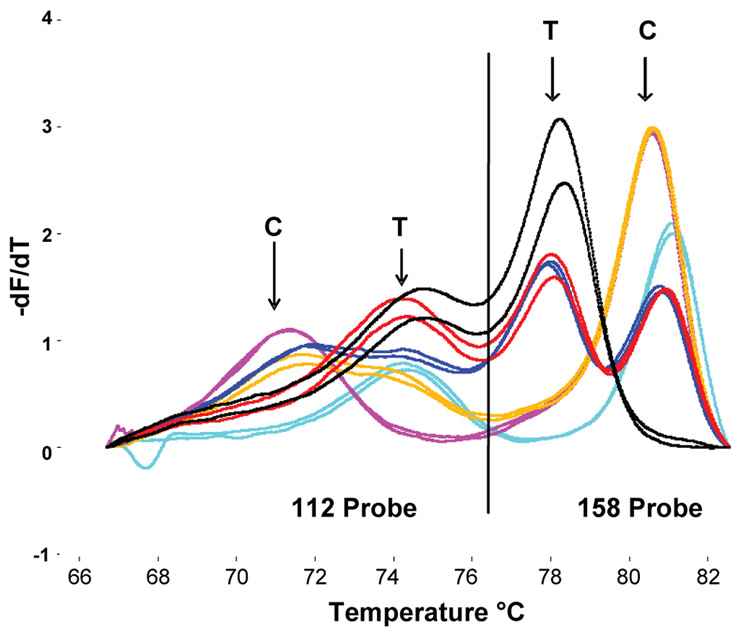
Figure 6.
Derivative melting plots for APOE genotyping using two unlabeled probes added after asymmetric PCR. The vertical black line separates data generated by probes that target the 112 (left) and 158 (right) codons. All six common genotypes: e2/e2 (black), e2/e3 (red), e2/e4 (dark blue), e3/e3 (light blue), e3/e4 (orange), and e4/e4 (pink) are shown in duplicate. Reprinted with permission from BioTechniques 43, 87–91 (2007).

