Figure 3.
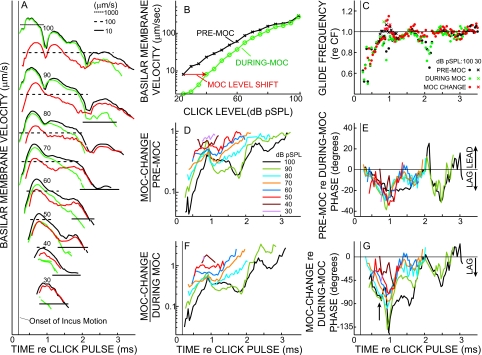
Analyses of MOC effects on BM click responses in one experiment. (A) BM click-response amplitudes from short-term FFTs for pre-MOC (black), during-MOC (green), and MOC-change (red) [same color code applies to (B) and (C)] for eight click levels. The numbers show the click level in dB pSPL. Responses at different levels are shown on the same scale, but are displaced vertically for clarity. The horizontal lines show amplitude registrations (key at top). (B) Pre-MOC (crosses) and during-MOC (circles) click-response amplitudes vs click level, showing the level shift produced by MOC stimulation (arrow). The click-response amplitude is the BM velocity at the frequency with the most energy in the FFT of the entire response [see Fig. 7(a) for full spectra]. (C) Glide frequency as a function of time for the highest and lowest click levels (see key). (D) Relative inhibition as a function of time, as shown by the MOC-change amplitude divided by the pre-MOC amplitude, both derived from short-term FFTs (see See. 2) with click level as a parameter [color key at right also applies to (E)–(G)]. (E) The phase of the pre-MOC response relative to the during-MOC response with click level as a parameter. (F) Relative inhibition shown by the normalized MOC change, which is the MOC-change amplitude divided by during-MOC amplitude (during-MOC chosen instead of pre-MOC because it is closer to the passive response). (G) The phase of the MOC change relative to the during-MOC response, with click level as a parameter. The arrow indicates the time when the phase difference at the highest levels best shows the phase of traveling-wave amplification (see Sec. 4). GP3144. CF=13.5 kHz.

