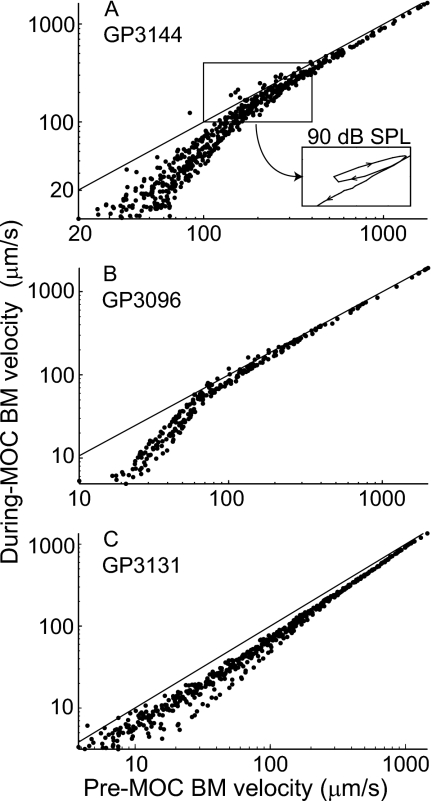
Figure 5.
BM velocity during MOC stimulation vs before MOC stimulation for responses to clicks in three guinea pigs. Each panel shows data from all click levels superimposed. Note that, in each animal, the points from different click levels fall approximately along the same locus. The inset in (A) shows the data from 90 dB SPL clicks to illustrate the pattern across the period of an envelope minimum. The aberrations induced by such response waning ranged from a loop, as shown in the inset in (A), to a small jump to the side (not illustrated). The diagonal lines illustrate equality, where the during-MOC and pre-MOC velocities are the same.

