
Fig. 1. Time course of MOM-Sal-B stimulation of ERK1/2 phosphorylation and antagonism by the selective KOR antagonist, NorBNI in type-1 immortalized astrocytes transiently transfected with KOR cDNA.
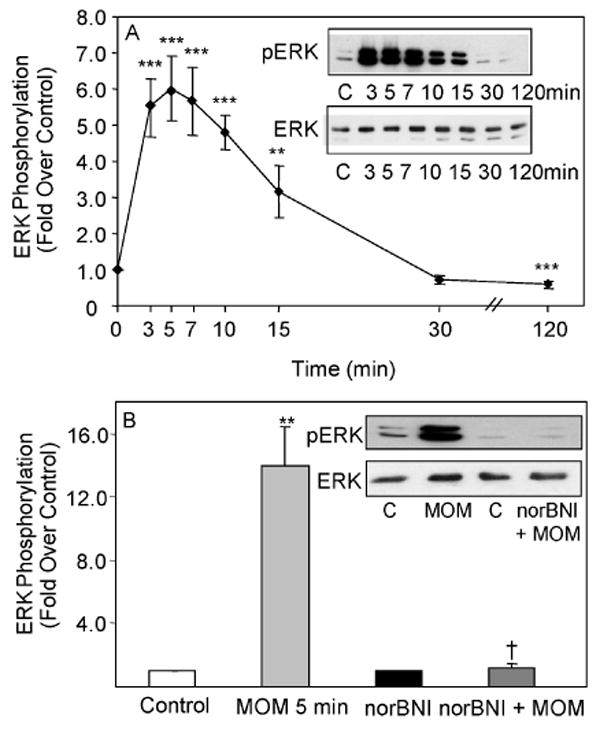
A. Cells were treated with 1 μM MOM-Sal-B and assayed at the indicated time intervals. N= 4-8. **p< 0.01, ***p< 0.001 vs. control. B. Cells were pre-treated with 1 μM NorBNI for 1 h, followed by a 5 min treatment with 1 μM MOM-Sal-B. N=4. **p< 0.01 vs. control, †p< 0.05 vs. agonist alone. The gels are representative immunoblots showing phosphorylated ERK1/2 and total ERK1/2 bands. The graph and curves show quantified ERK1/2 phosphorylation based on phosphoERK1/2 to ERK ratios.