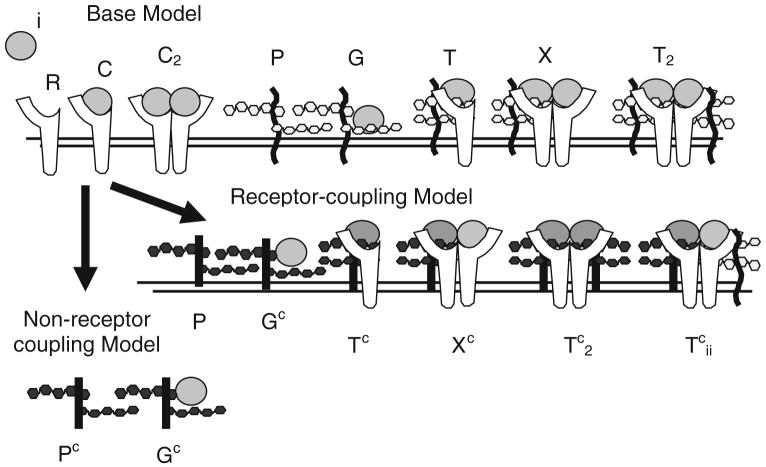
FIGURE 2.
Schematic diagram illustrating species within “non-receptor-coupling” and “receptor-coupling” models. Base model interactions show the ligand (i), receptor (R), ligand-receptor complex (C), unbound (P) and ligand bound (G) unique HSPG site, ternary complex (T), and ligand-receptor dimers (C2) with one (X) and two (T2) unique HSPG sites which are common to both models. Identical sets are included for each ligand i. In the “Non-receptor-coupling” model, the common HSPG sites (Pc) bind ligand (Gc) but do not interact with receptors. In the “receptor-coupling” model, the common HSPG (Pc) bind ligand (Gc) and form higher order complexes with receptors (Tc, Xc, , ). Specific reactions are shown in Table 1.

