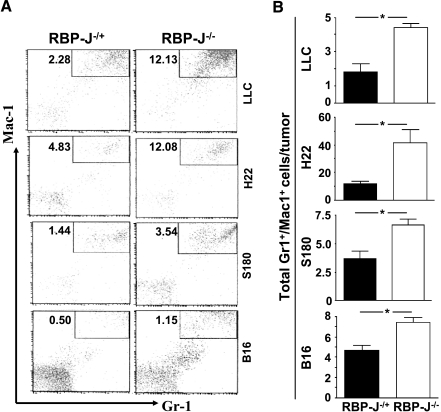
Figure 3.
Infiltration of Gr1+/Mac1+ cells in tumors grown in the RBP-J knockout and control mice. (A) FACS analysis. Tumors grown in the RBP-J-/- and control mice were dissected and were minced to obtain single-cell suspensions. FACS was carried out using PE-anti-Mac1 and fluorescein isothiocyanate-anti-Gr1. Pictures represent one set of three to five independent experiments. (B) The number of Gr1+/Mac1+ cells in tumors was calculated based on FACS shown in (A). Bars, means ± SD. *P < .05. n = 3 in LLC; n = 3 in S180; n = 5 in H22; and n = 5 in B16, respectively.

