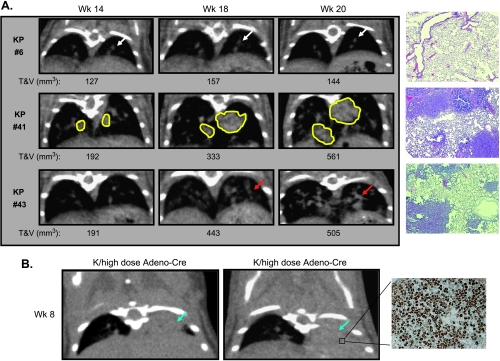
Figure 3.
Representative micro-CT images of lung tumors from Figure 2. (A) Visualization of lung tumor development in K-rasLSL-G12D/p53LSL-R270H (KP) or K-rasLSL-G12D (K) models. Panel 1: Example of CT images of a control KP mouse with no tumor and H&E stain. Panel 2: Example of CT images of a KP mouse infected with a high dose of Adeno-Cre virus with isolated lung tumors and H&E stain. Panel 3: Example of CT images of a KP mouse infected with a high dose of Adeno-Cre virus with small multifocal tumors and H&E stain. (B) Lung images of macrophage infiltration and histologic staining with a purified rat antimouse Mac-3 antibody (BD Pharmingen, Mississauga, Ontario, Canada) in virus-infected mice. Blue arrow indicates microphage filled lung; white arrow, normal vasculature; yellow line, isolated tumor.

