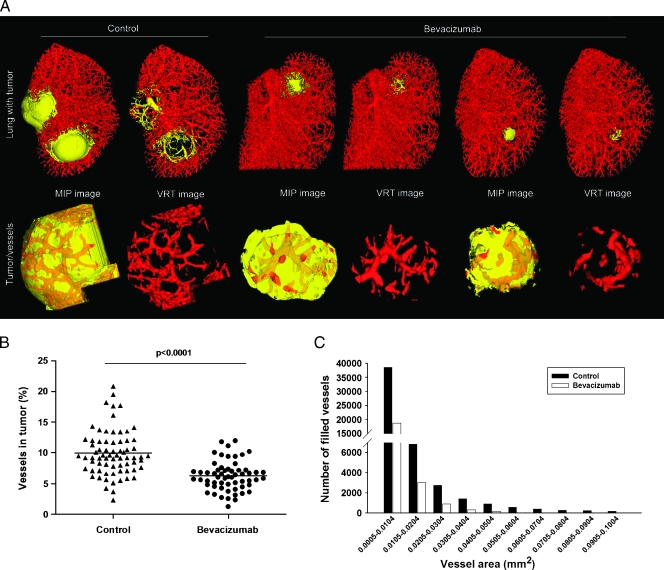
Figure 4.
Measurements of tumor angiogenesis after site-specific therapy. (A) Three-dimensional surface rendering images of lung tumors from untreated and bevacizumab-treated mice. Extracted tumors and tumor microvascularization are shown (yellow represents tumor tissue area; red represents tumor vessel area). (B) Number of vessels measured with micro-CT after 14 days of bevacizumab treatment (•) or without treatment (▴). (C) Bar graph showing the detailed information that vessels were in tumor by vessel area (mm2; n = 12 mice for each group; extracted tumors from each mouse = ∼5–6).

