Figure 2.
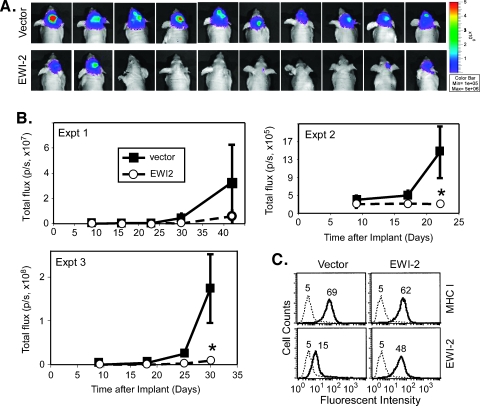
In vivo tumor formation. (A) T98G cells (4 x 10⁶ cells) were injected subcutaneously into nude mice (in two flanks, four mice per cell line), and tumor sizes, (l)(w)(h)(0.52), were determined after 90 days. *P < .05 when EWI-2 samples are compared with vector control results. P < .02 when EWI-2 samples are compared with pooled control experiments (vector control plus CD2 control), according to Fisher exact test. (B) U87-LucNeo and U87-LucNeo/EWI-2 cells (50,000) were each injected intracranially into 10 nude mice and then imaged after 14 days. (C) Three independent experiments were carried out as in (B), and tumor size was quantitated by in vivo bioluminescence imaging (*P < .05). Note that tumors were observed in 100% of vector control mice. The arbitrary units representing photon flux values (y-axes) show interexperimental variability that may arise owing to the use of different stocks of luciferin, altered imaging parameters, altered size of the imaging area, or other variables. However, these parameters were carefully controlled intraexperimentally. (D) Cell surface expression of EWI-2 and control MHC class I in U87-LucNeo cells.

