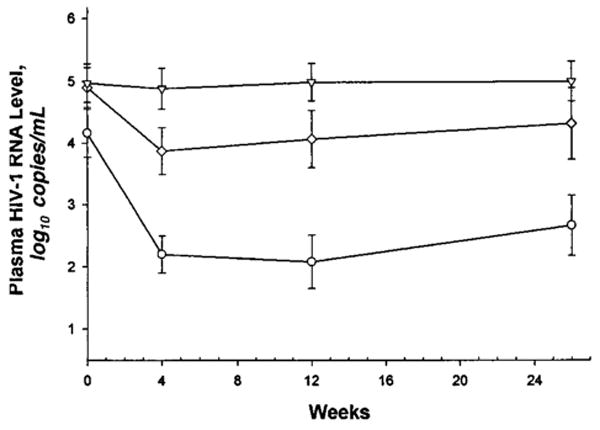
Figure 1. Virologic response to saquinavir plus ritonavir through week 26 based on response by week 12.

See the Methods section for further explanation. Triangles represent nonresponders; diamonds represent partial responders; circles represent complete responders.
