
Figure 2. Frequencies of protease and reverse transcriptase mutations by virologic response at week 12.
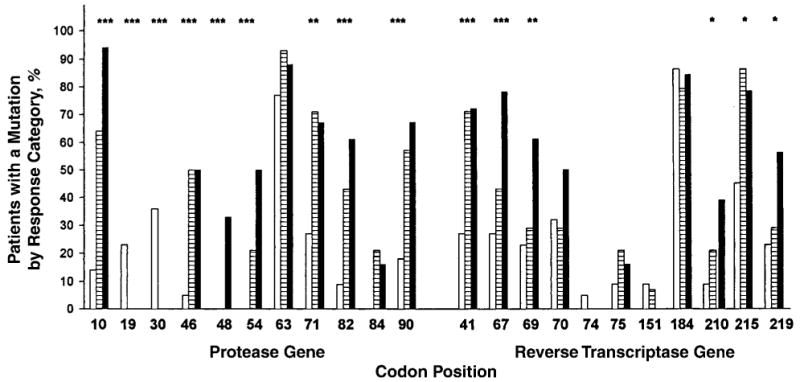
Mutation frequencies at baseline in complete responders (white bars), partial responders (striped bars), and nonresponders (solid bars) are shown. *P < 0.05; **P < 0.01; ***P < 0.001 (as bivariate predictors).