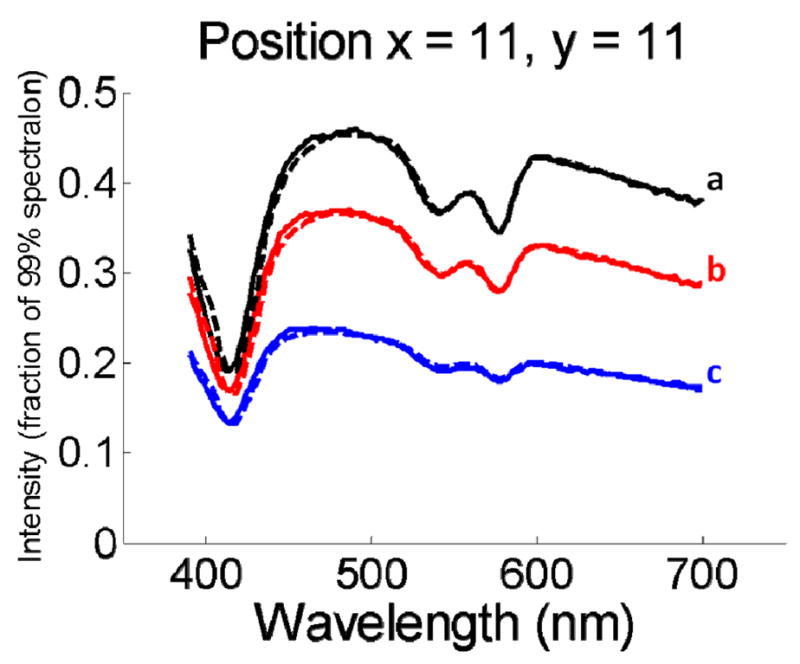
Fig. 2.

Calibrated reflectance spectra (solid lines) measured from the same imaging position on different tissue phantoms. The best fit spectra using the approach of Zonios et al. are also plotted (dashed lines). The characteristic absorption bands of hemoglobin at 420nm, 540nm, and 580nm are clearly visible.
