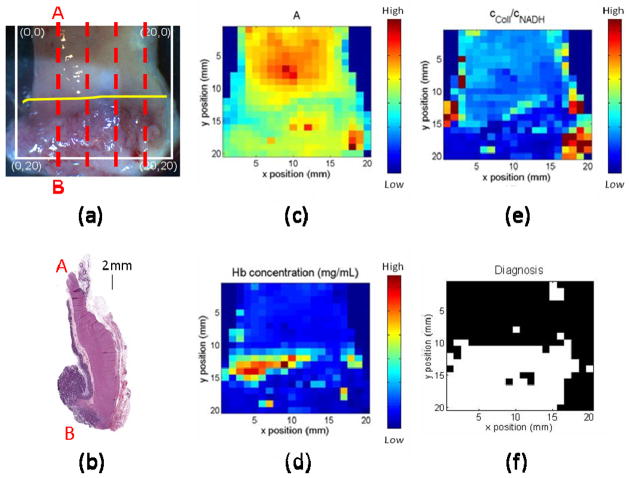
Fig. 4.
(a). White light image of ex vivo colon specimen. (b): Ex vivo colon pathology. The specimen is sectioned from the region indicated by the left red line in (a). Parameter maps of A, cHb, and cColl/cNADH are shown in (c) – (e). Maps can be compared to the picture in (a) by matching the coordinates with units in millimeters. (f): Diagnosis map with black normal and white cancerous tissue. The diagnosis using QSI is constant to the diagnosis using histopathology which indicates area below yellow line in (a) is cancerous.

