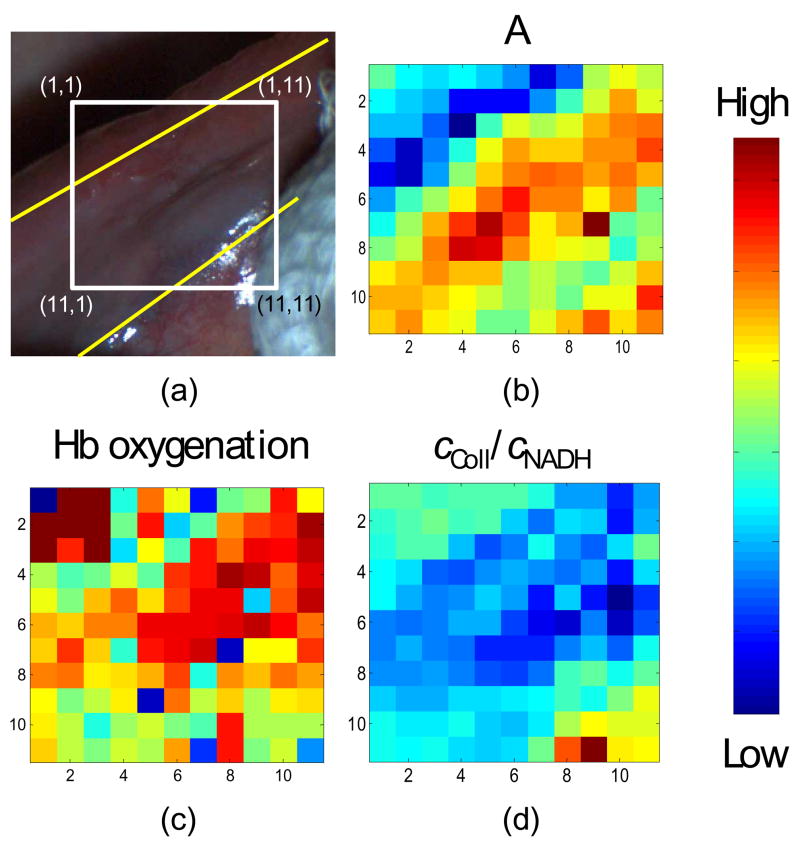
Fig. 5.
(a). White light image of ventral tongue site with the boundaries, between hyperkeratosis and normal areas, delineated by the dashed yellow lines. The coordinates are in millimeters. Data in (b) – (d) can be compared to the picture in (a) by matching the coordinates. (b) A parameter. (c) α parameter. (d) cColl/cNADH parameter.

