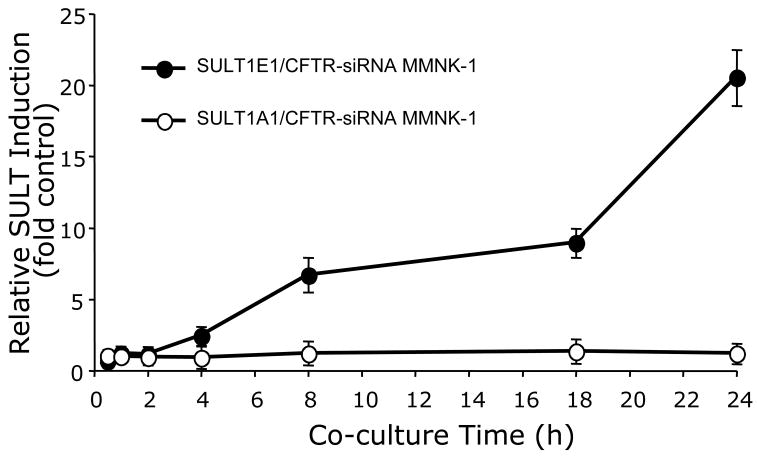
Figure 3.
Time course of SULT1E1 and SULT1A1 expression in HepG2 cells during co-culture with control- or CFTR-siRNA MMNK-1 cells. HepG2 cells were co-cultured with either control-siRNA or CFTR-siRNA MMNK-1 cells for 30 min, 1 h, 2 h, 4 h, 8 h, 18 h or 24 h in triplicate wells. Total RNA was then extracted and utilized for qRTPCR analysis of SULT1E1 or SULT1A1 as described in Methods with ribosomal 18S RNA as the endogenous control for total RNA normalization. mRNA expression levels were calculated using the Ct method, where the calibrators were samples from normal HepG2 cells with no MMNK-1 co-culture. Relative expression of SULT1E1 and SULT1A1 was expressed as fold-change between normal HepG2 cells and co-culture with control- or CFTR siRNA MMNK-1 cells, using the mean value from 3 replicate wells. The results are expressed as fold change ± s.d. and the standard deviations for the replicate wells were no larger than 6%.

