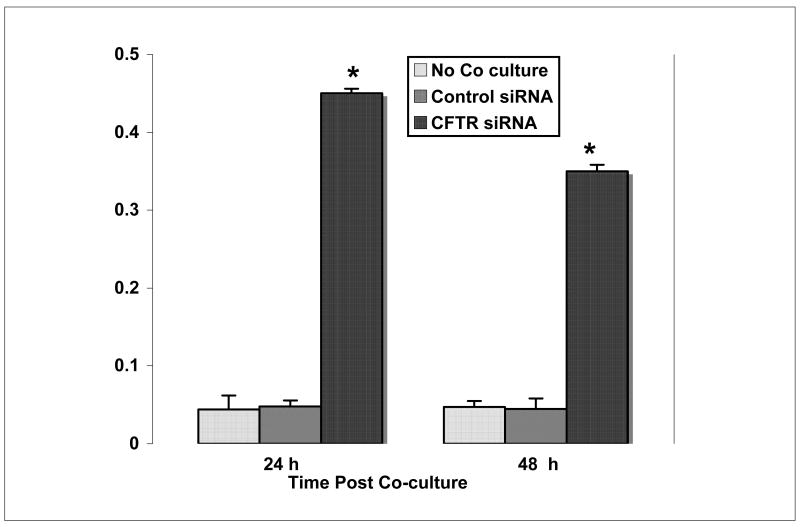
Figure 4.
Selective induction of SULT1E1 activity in HepG2 cells co-cultured with CFTR-siRNA MMNK-1 cells. HepG2 cells were cultured alone, or co-cultured with control-siRNA or CFTR-siRNA-MMNK-1 cells for 8 h then transferred to fresh medium and incubated for 24 or 48 h alone. Cellular lysate was then prepared with M-PER and assayed for E2 sulfation activity as described in Methods. E2 sulfation activity is expressed as pmol/min/mg protein. Each point represents the mean of SULT1E1 activity in lystae prepared from three separate wells and each lysate was assayed in triplicate. SULT1E1 activity is expressed as pmol E2 sulfated per min per mg protein ± s.d. The asterisk denote a significant difference at p<0.01 from the SULT1E1 sulfation rate in HepG2 cells with no co-culture using the Student’s T-test.

