
Figure 3.
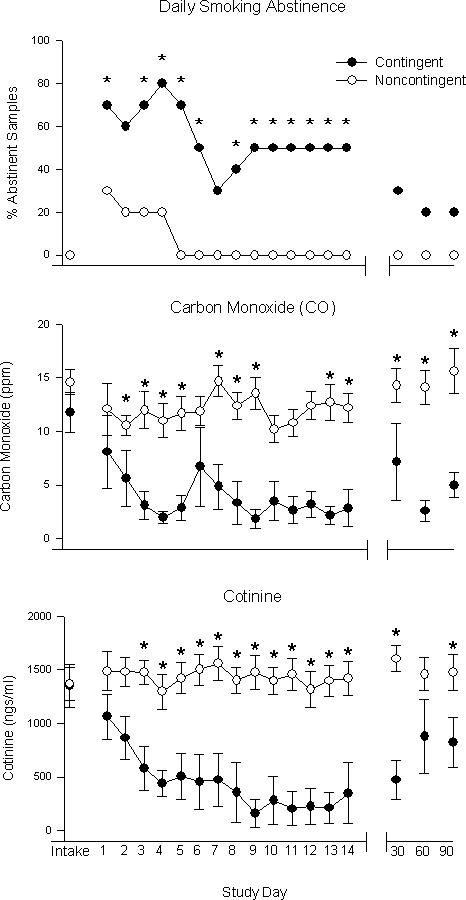
Additional measures of smoking on a daily basis are shown for the contingent (filled circles) and noncontingent (open circles) groups across the 14-day intervention and at 30-, 60-, and 90-day follow-ups. Percentages of total abstinent samples at each visit are shown for both groups (top). Mean CO levels at each visit are shown for both groups (middle). Mean cotinine values at each visit are shown for both groups (bottom). Statistical differences (p < .05) are indicated by an asterisk, and brackets indicate SEM.