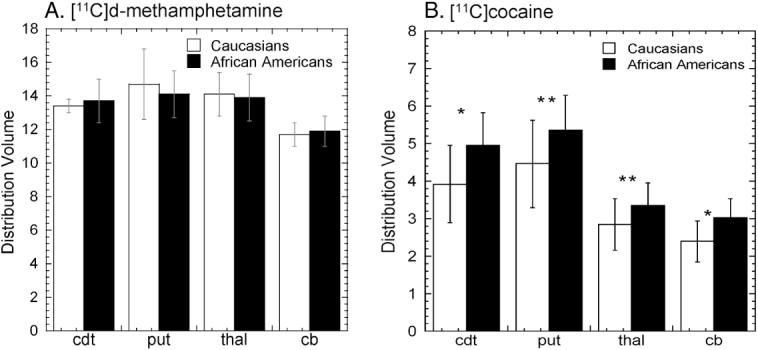
Fig. 2.

(A) Average distribution volumes ± sdm for [11C]d-methamphetamine for Caucasians (n=9) and African Americans (n=10). Unpaired t-test revealed no difference between the two groups. We note that for both groups the DV’s in the caudate, putamen and the thalamus were significantly greater than those in the cerebellum (p=0.0001). (B) average distribution volumes ± sdm for [11C]cocaine for Caucasians and African Americans. Unpaired t tests revealed significantly higher DV for the caudate and cerebellum (p<0.05) with a trend for the putamen and thalamus (p=0.09) (left panel) for the African Americans. (cdt=caudate; put=putamen, thal=thalamus; cb=cerebellum).
