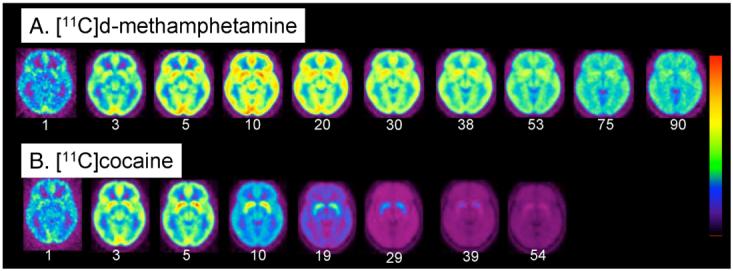
Fig. 4.

(A) Averaged images of [11C]d-methamphetamine (n=19) at the level of the striatum at different time frames over a 90 minute imaging session; (B) averaged images of [11C]cocaine (n=19) (bottom row) at the level of the putamen over a 54 minute imaging session. Note that [11C]cocaine peaks earlier and clears faster than [11C]d-methamphetamine. The time (minutes) for each frame is indicated below the image. We use a rainbow color bar where red represents the highest uptake and purple the lowest. The [11C]d-methamphetamine images, red corresponds to 0.006% injected dose/cc whereas for the [11C]cocaine images, red corresponds to 0.008% of the injected dose/cc. The dynamic images from both the [11C]d-methamphetamine and [11C]cocaine studies were normalized to the SPM 99 atlas (http://www.fil.ion.ucl. ac.uk/spm/) so that individual time frames could be averaged across subjects. The average time frame data was obtained by weighting each image by the factor f=avg dose/dose subj, summing over subjects and dividing by the number of subjects.
