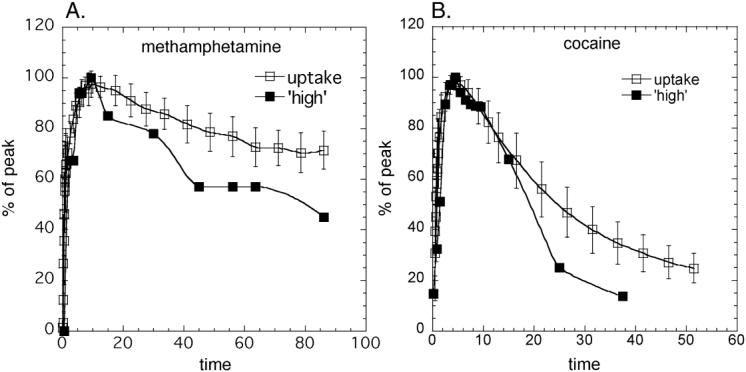
Fig. 5.

(A) Averaged time-activity curves for [11C]d-methamphetamine uptake in the ventral striatum (n=19) along with the time course of the ‘high’ (Newton et al., 2006); (B) Averaged time-activity curves for [11C]cocaine uptake in the putamen (n=19) along with the time course of the ‘high’ (Volkow et al. 1997). Both the time-activity curves and the time course for the ‘high’ were normalized to the highest value for presentation.
