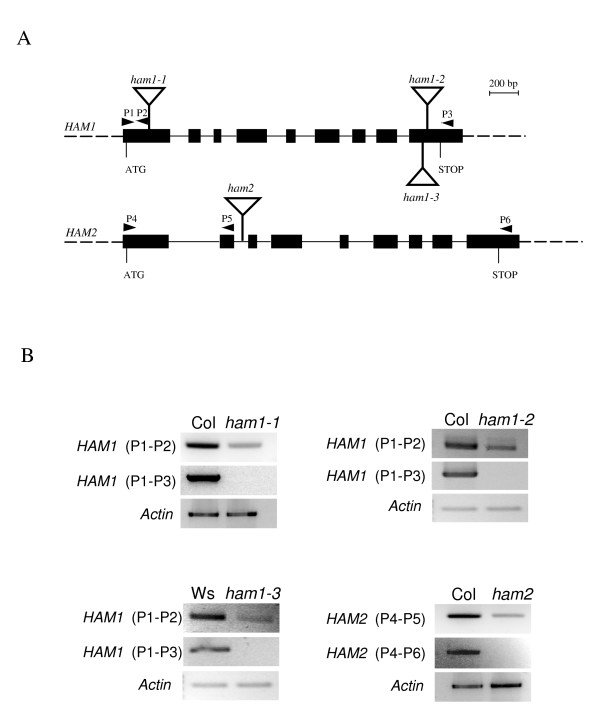
Figure 2.
Characterization of T-DNA insertion mutations within HAM1 and HAM2. (A) Schematic representation of the T-DNA insertions in the HAM1 and HAM2 genes. Black boxes and solid lines denote exons and introns, respectively. The filled triangles represent the six PCR primers used in RT-PCR (see "Methods"). (B) RT-PCR analysis of HAM genes expression in homozygous insertion mutants and wild-type seedlings with primer pairs P1–P2, P1–P3, P4–P5 and P4–P6 as indicated in (A).

