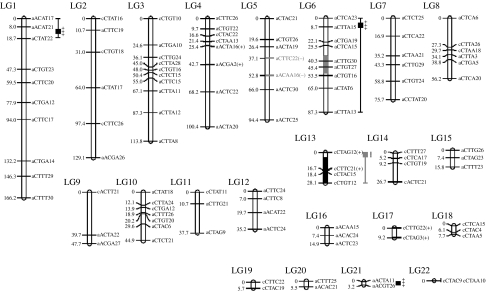
Figure 1.
Linkage map of dominant I. brevicaulis iris retroelements (IRRE) retrotransposon display markers (Kentner et al. 2003; Bouck et al. 2005) segregating in the F1 hybrid used to produce backcross hybrids towards I. fulva. Significant QTL for survival in greenhouse conditions are denoted (with 2-LOD CIs—LOD scores a distribution of distances from genetic markers estimated from recombination frequencies; CIs are the confidence intervals around these estimates) to the right of the marker names (Martin et al. 2005). Black or stippled bars (2-LOD CIs) denote QTLs for survival under natural conditions (Martin et al. 2006). Stippled bars represent regions where introgressed (hybrid/heterozygous) regions are favoured, while black bars represent regions where recurrent (parental/homozygous) regions are favoured.

