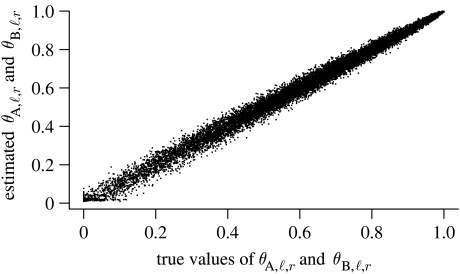
Figure 2.
Posterior mean estimates (y-axis) versus true values (x-axis) of the frequency of the recessive r allele from either species gene pool (A or B) across all simulated datasets (both LD and HD conditions) with H=100 and L=100.There are 20 000 points in total, each one corresponding to an allele frequency at a single locus in species A or B.

