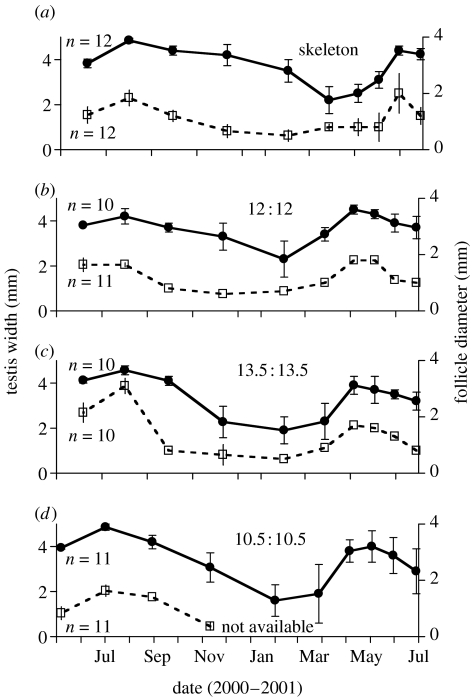
Figure 2.
Temporal (approx. bimonthly) changes in gonad (circle) and follicle (square) sizes of house sparrows exposed to the photoperiods as indicated (see explanation in figure 1). Data are means±1s.e. Sample sizes for each group are indicated in (a–d). Data for females in the 21-h day group are missing after November 2000 due to equipment failure.

