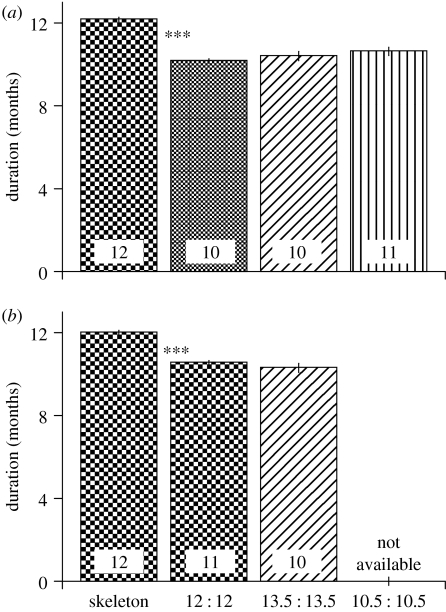
Figure 3.
Circannual periodicities of gonad (a) and follicle (b) sizes of house sparrows exposed to various photoperiods (explained in figure 1). Data show mean±1s.e., sample sizes are indicated in the columns. Stars denote significant differences as determined by Scheffe post hoc tests.

