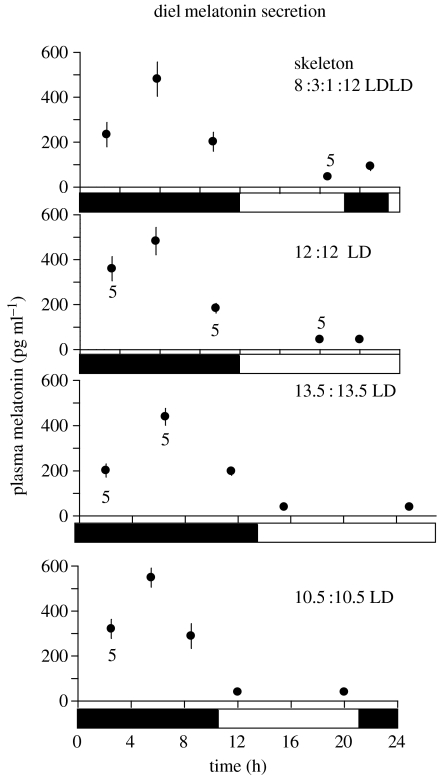
Figure 6.
Graphs showing temporal (within 24 h) changes in plasma concentrations of the hormone melatonin, for house sparrows exposed to the photoperiods as indicated (see explanation in figure 1). Data show means±1s.e., sample sizes are N=6 except when indicated, black bars indicate dark periods, light bars indicate light periods.

