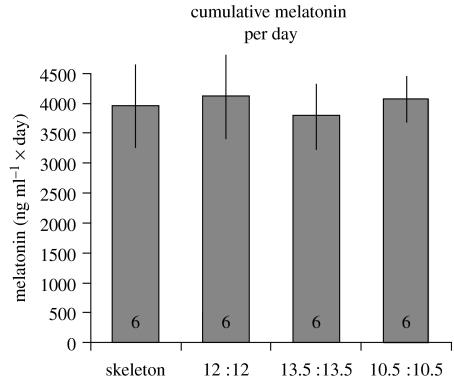
Figure 7.
Summary data on average melatonin concentrations of house sparrows exposed to various photoperiods (explained in figure 1). Averages are roughly approximated from data shown in figure 6 and calculated per day. Data indicate summed means±s.e., sample sizes are indicated in the columns (missing data were replaced by the population averages). We found no significant differences between the groups.

